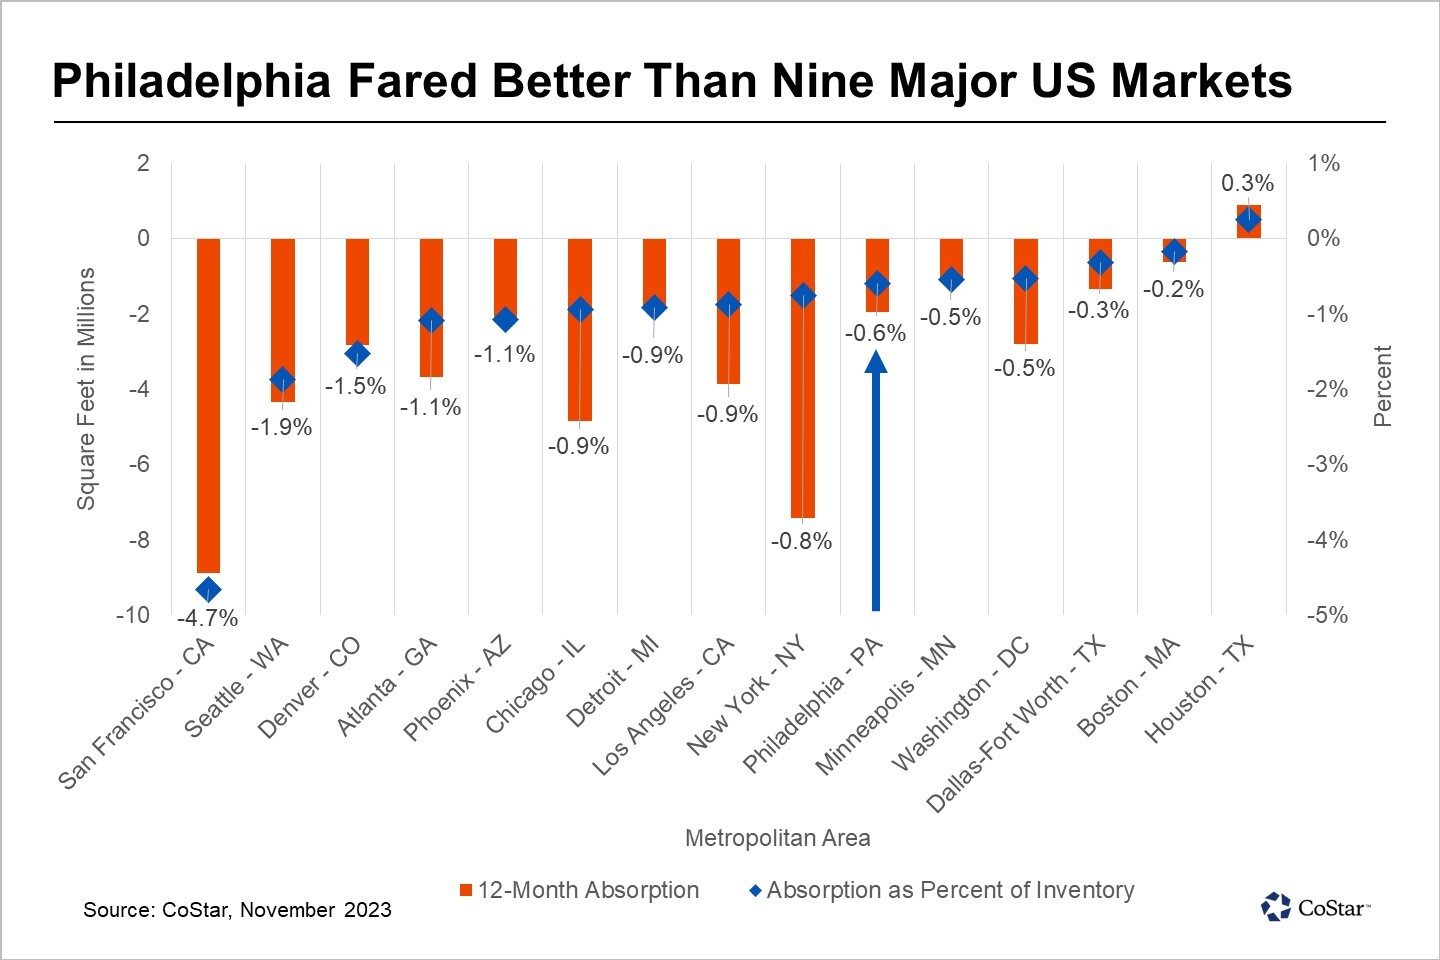
In the face of a nationwide, three-year trend of companies reducing the overall size of their offices, the Philadelphia metropolitan area has been weathering the storm better than several other major U.S. office markets. While Philadelphia saw nearly 2 million square feet of space returned to the office leasing market in the past year, nine of the 15 largest office metropolitan areas experienced even higher levels of unwanted office space as a percent of the total inventory returned by office occupiers.
This snapshot analysis looks at absorption rates, which is the pace at which occupied space changes over time. The annual absorption rate, calculated by dividing a market’s 12-month net absorption by its total office space, provides another perspective on leasing performance while accounting for market size differences. For instance, an absorption loss of 1 million square feet has very different implications for an office market the size of New York City, which has 980 million square feet, compared to Philadelphia's 330 million square feet of office space.
As of the fourth quarter, the U.S. recorded nearly 62 million square feet in negative absorption, resulting in an annual absorption rate of negative 0.7%. Philadelphia's absorption rate of negative 0.6% aligns closely with the national average. This reflects a broader trend where Philadelphia closely follows national office performance. The U.S. and Philadelphia each experienced a 430-basis-point increase in office availability since early 2020, even though Philadelphia's availability rate has historically held lower than the national average.
Meanwhile, nine of the 15 largest U.S. metropolitan areas logged even larger negative annual absorption rates than the national annual average.
San Francisco led the nation with a negative absorption of 9.3 million square feet, reflecting a negative 4.7% absorption rate, followed by Seattle which posted a negative 1.9% absorption rate and Denver at negative 1.5%. In contrast, Houston was the only metropolitan area to experience positive absorption at 900,000 square feet, equating to a 0.3% absorption rate. Minneapolis and Washington D.C., both logged a negative 0.5% rate, on par with Philadelphia's.
These figures only provide a snapshot of the past 12 months, so it's essential to recognize that conditions affecting the office market will continue to evolve over the next year. With more office leases set to expire throughout the country, rankings based on recent absorption rates may shift considerably across these metropolitan areas.
Each region’s ability to adapt to these changes will continue to be influenced by its distinctive economic composition, regional dynamics and local public-private leadership.

No comments:
Post a Comment
Note: Only a member of this blog may post a comment.