By Mark Heschmeyer CoStar News
Commercial real estate pricing dropped during a dramatic slowdown in transaction volume during the coronavirus pandemic, according to the latest monthly CoStar Commercial Repeat Sale Indices.
The repeat sales of $39.1 billion for the first five months of 2020 fell 24.2% from the same time a year earlier. This is the first look at the year's commercial real estate pricing trends, calculated by using the price change from the pair of first and second sales of properties sold multiple times. The indices are based on 538 repeat sales in May and more than 227,324 since 1996.
“While volume generally held up well versus the prior year in the first three months of 2020, it dropped more precipitously in April and May, reflecting overall caution among investors as well as physical challenges in transacting deals in a lockdown,” said Nancy Muscatello, managing consultant for CoStar. “The deceleration in deal volume was felt across the size and building-quality spectrum.”
In the investment-grade property segment, repeat sales volume was down 25.1% in the first five months of 2020 compared to the same time a year earlier. The group reflects larger asset sales common in major markets.
The general commercial segment, which reflects the more numerous but lower-priced property sales typical of secondary and smaller markets, was down 22.4%.
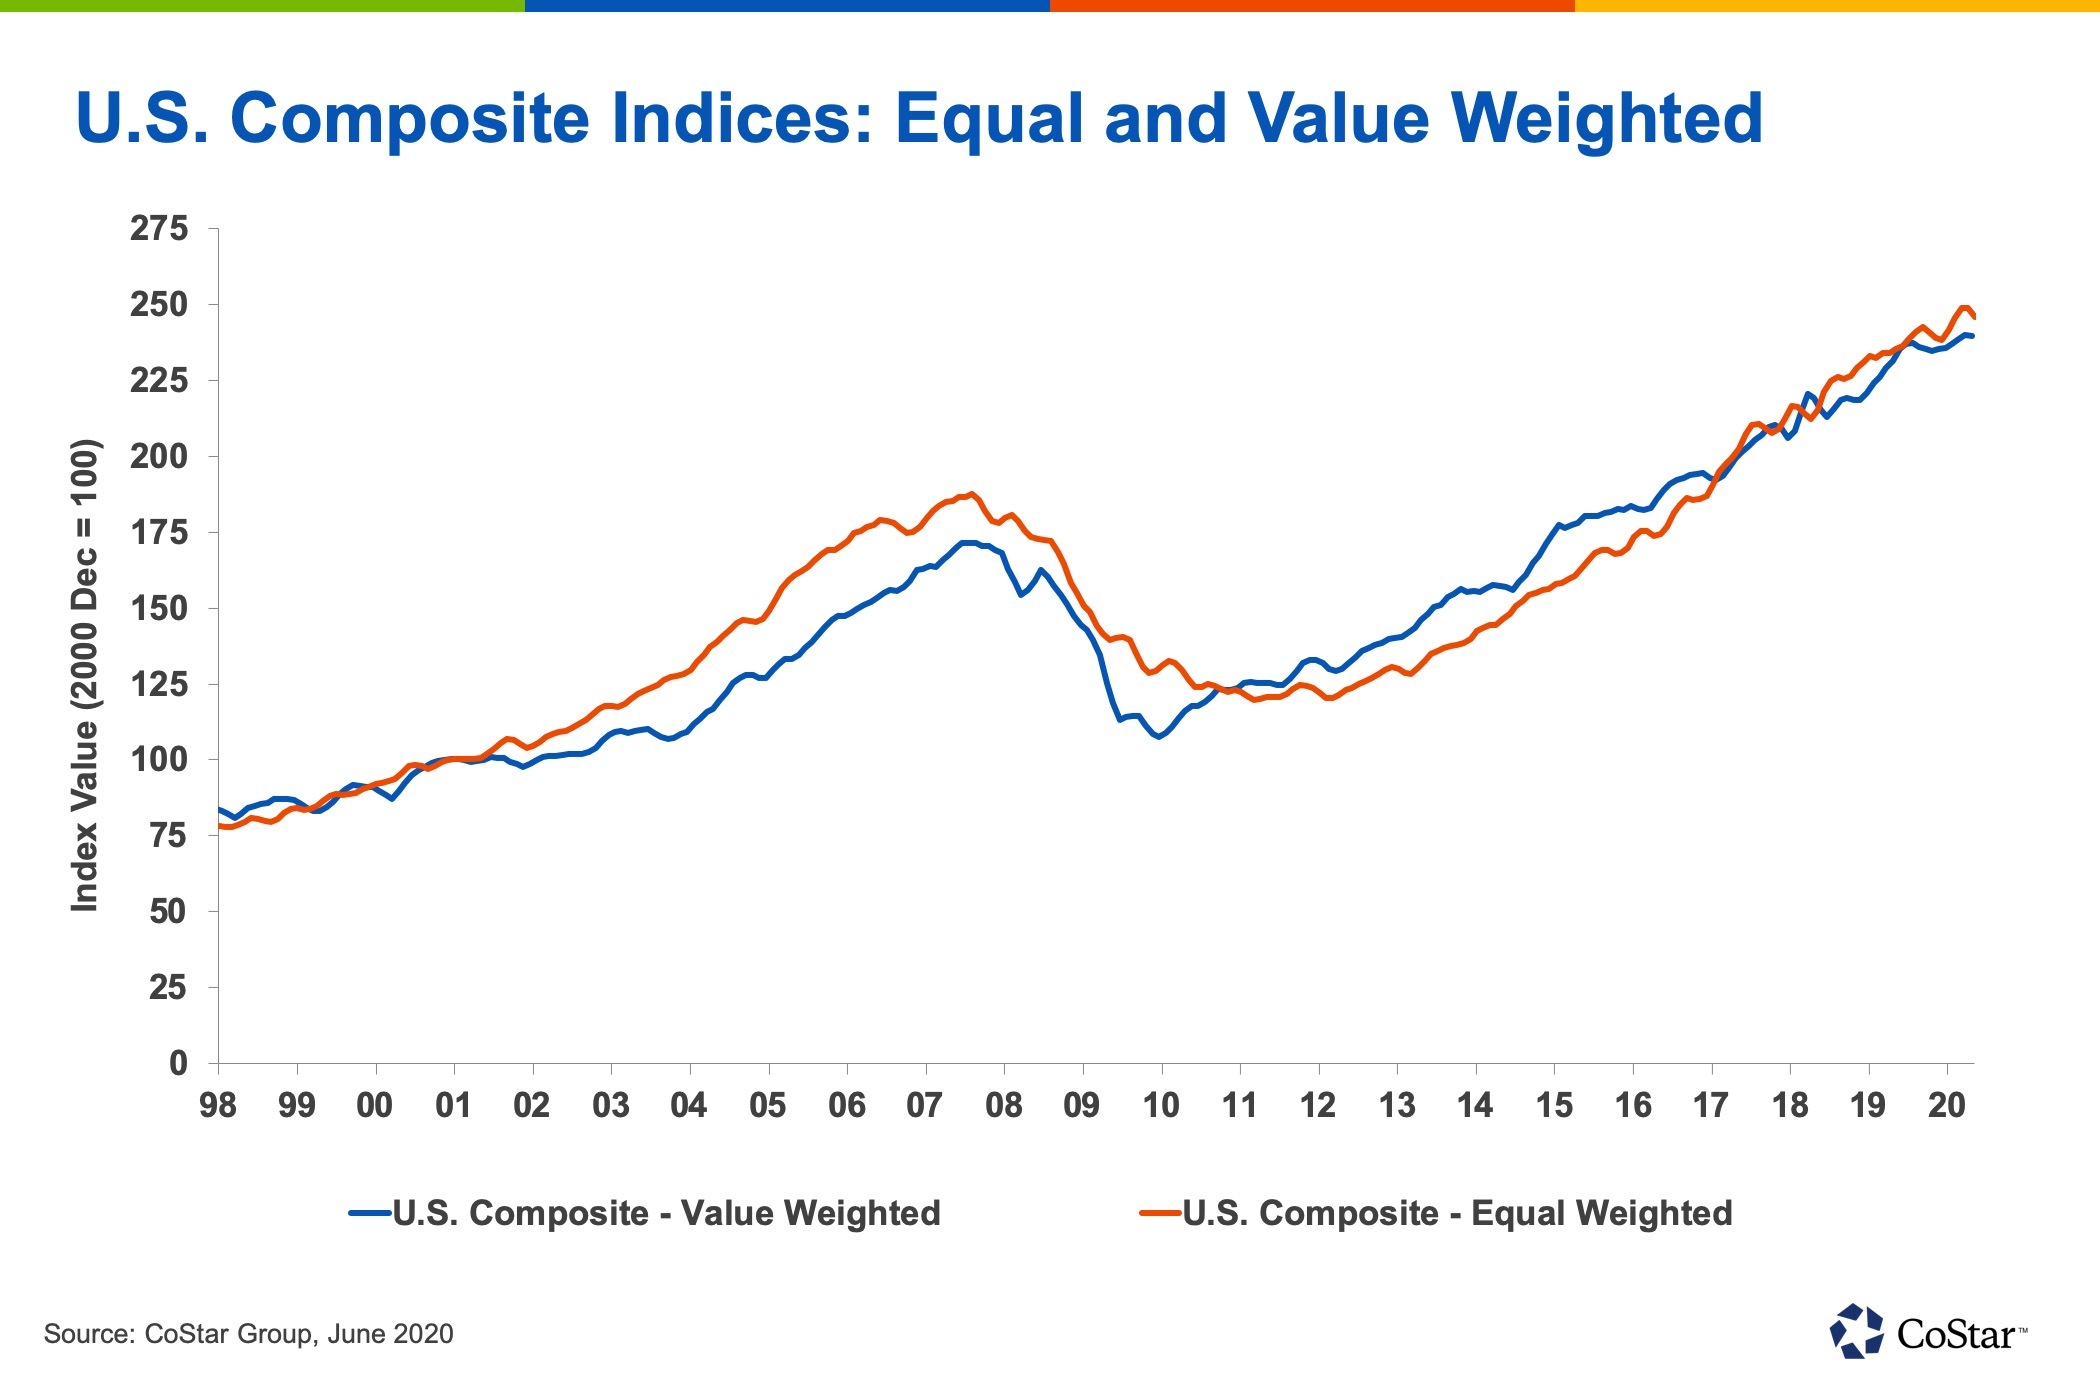
Both of the two major composite price indices declined in May, reflecting investor uncertainty and slower deal volume. However, both indices were still up between 3% to 5% on an annual basis over more than two decades.

The equal-weighted U.S. Composite Index, which reflects the more numerous, but lower-priced property sales typical of secondary and smaller markets, fell 1.3% but was still up over time.

The value-weighted U.S. Composite Index, which reflects larger asset sales common in major markets, declined by a more modest 0.1% in May after gaining since the Great Recession

The rate of commercial construction deliveries has also slowed due in part to delays stemming from lockdown measures in some states. Deliveries as a percent of total inventory across the three major property types — office, retail and industrial — are projected to total 515 million square feet in the 12 months ending in June, down 5.2% from the same time a year earlier.
Notably too, the rate of construction completions going into the pandemic is also much lower than at the peak of the last cycle of economic expansion. During the height of that growth between 2007 and 2008, quarterly deliveries averaged 0.44% of total building inventory. In the past four quarters through June, deliveries averaged just 0.23% of total inventory.
“More subdued construction levels going into a downturn may help to blunt the impact of weaker demand on vacancy rates,” Muscatello said.

No comments:
Post a Comment
Note: Only a member of this blog may post a comment.